
Electricity cost is the largest recurring variable expense on an ISBM production line — yet most buyers receive only a single “total rated power” figure from suppliers during the evaluation process. This figure, the sum of all installed motor nameplate ratings, is not the number that appears on your electricity bill. A machine rated at 53.2 kW typically draws 28 to 42 kW during steady-state production, depending on platform type, bottle geometry and cavity count. The difference between nameplate and actual running power is the difference between an electricity budget that is 60% higher than reality and one that matches your actual costs. This guide provides the actual measured running power data for the full Henggang ISBM range — HGY50 through HGYS280 — together with the formulas to calculate annual electricity cost at Russian industrial rates, a full comparison of full-servo versus hydraulic cost difference, and worked examples that translate machine power data into ruble cost figures for production planning.
1. Nameplate Power vs Actual Running Power: Why They Differ
Every motor installed in a machine has a nameplate rating — the maximum power it can draw continuously without overheating. The sum of all motor nameplate ratings is the figure suppliers quote as “total machine power” on specification sheets. For an HGY150-V4-EV, this total is 53.2 kW (43.2 kW servo drives plus 10 kW barrel heating). In practice, no machine draws its nameplate total during steady-state production. The difference arises from three sources:
- ▶Motors draw power proportional to load, not nameplate rating. A 10 kW motor running at 60% mechanical load draws approximately 6.5 kW — not 10 kW. Injection servo motors on ISBM machines are at maximum load only during the injection phase (typically 1.5 to 3.0 seconds of a 5.5 to 8.0 second cycle). For the remaining 60 to 70% of the cycle, they draw a fraction of rated power.
- ▶Barrel heaters operate at duty cycle, not continuous full power. Once the barrel reaches setpoint temperature, the heater bands cycle on and off to maintain temperature. During steady-state production with a hot barrel, heater duty cycle is typically 25 to 45% — meaning the 10 kW heater rating translates to 2.5 to 4.5 kW average draw.
- ▶Hydraulic pumps behave differently from servo motors. A hydraulic pump runs at near-constant power regardless of whether hydraulic force is being demanded at that moment in the cycle. This is the fundamental energy inefficiency of hydraulic drive — it explains why hydraulic ISBM machines draw a much higher fraction of their nameplate rating during steady-state production than full-servo machines.
| Machine Platform | Rated Total Power | Typical Running Power | Running as % of Rated |
|---|---|---|---|
| Full servo (EV / Y150-V4-B) | 53.2 kW | 28 – 36 kW | 53 – 68% |
| Hydraulic (standard HGY150-V4) | 53.2 kW | 38 – 46 kW | 71 – 86% |
The planning implication: If your electricity budget is based on nameplate power at the planned operating hours, you are overestimating actual costs by 30 to 50% for full-servo machines and 15 to 30% for hydraulic machines. Use the running power figures in this guide — not nameplate — for budget preparation. Conversely, if a supplier quotes a suspiciously low running power figure without measurement data, apply the percentages above to their nameplate rating to estimate the realistic minimum.
2. Where the Power Goes: ISBM Subsystem Breakdown
Understanding which subsystem consumes which share of total machine power identifies where reduction efforts have the greatest leverage. The proportions below are for steady-state production at rated cavity count and cycle speed, measured at the machine main panel incomer:
| Subsystem | Full Servo Share | Hydraulic Share | Key Variable |
|---|---|---|---|
| Injection drive (servo motors or hydraulic pump) | 38 – 48% | 55 – 65% | Cycle time and shot weight |
| Barrel heating (nano far-infrared heater bands) | 20 – 32% | 15 – 25% | Resin type and ambient temperature |
| Turntable and auxiliary servo drives | 12 – 18% | 8 – 14% | Turntable inertia and station count |
| PLC, HMI, panel controls and lighting | 3 – 6% | 2 – 5% | Constant — runs 24 hours |
| Hydraulic oil cooling fan (hydraulic machines only) | N/A | 5 – 10% | Ambient temperature dependent |
Note that the machine main panel meter does not include auxiliary equipment — the air compressor, chiller and mold temperature controller are on separate electrical feeds. Section 7 covers auxiliary power separately. The full line total is machine power plus auxiliary power.
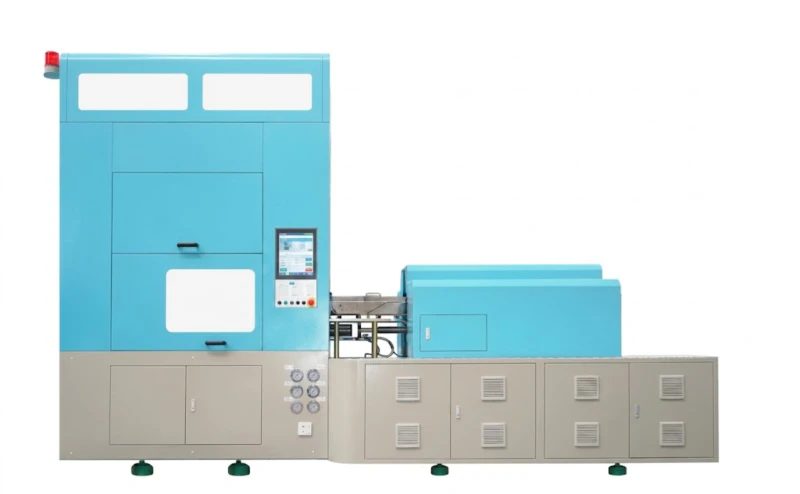
Fig. 1 — The HGY150-V4-EV injection unit. The 10-axis servo drive system (43.2 kW rated) draws power only during active mechanical work phases. During cooling and turntable rotation — approximately 60% of each cycle — the servo drives idle at near-zero draw. The barrel heater bands (10 kW rated) operate on a 25 to 45% duty cycle during steady-state production.
3. Actual Power Data: HGY50 to HGYS280 Full Range
The following data covers the complete Henggang ISBM machine range. Running power figures are measured values from factory testing at the rated production parameters — not nameplate calculations. The reference conditions for each model are the standard 4-cavity PETG configuration at the machine’s target cycle time.
4. Full Servo vs Hydraulic: The Energy Cost Difference Quantified
Both the HGY150-V4 (hydraulic) and HGY150-V4-EV (full servo) share the same 53.2 kW nameplate rating. Their actual running power in production differs by 10 to 18 kW — a difference that accumulates over every production hour for the machine lifetime. The table below shows the annual electricity cost difference at Russian industrial rates:
| Parameter | HGY150-V4 (Hydraulic) | HGY150-V4-EV (Full Servo) | Annual Saving (Servo) |
|---|---|---|---|
| Average machine running power | 42 kW | 32 kW | ↓ 10 kW |
| Annual machine consumption (6,000 h) | 252,000 kWh | 192,000 kWh | 60,000 kWh |
| Annual electricity cost (7 RUB/kWh) | 1,764,000 RUB | 1,344,000 RUB | 420,000 RUB/yr |
| Annual electricity cost (8.5 RUB/kWh) | 2,142,000 RUB | 1,632,000 RUB | 510,000 RUB/yr |
| Additional chiller load (hydraulic heat) | +2.5 – 4.0 kW chiller | None | +105,000 – 168,000 RUB/yr |
Total servo energy advantage per year: At 7 RUB/kWh and 6,000 production hours, the combined machine and chiller saving from choosing the HGY150-V4-EV over the HGY150-V4 is approximately 525,000 to 588,000 RUB per year — equivalent to USD 5,800 to 6,500 at 90 RUB/USD. The typical purchase price difference between the two platforms is USD 30,000 to 40,000 — yielding a payback period of 4.6 to 6.9 years from electricity savings alone, before accounting for reduced maintenance costs on the servo platform.
5. Russian Industrial Electricity Rates: What You Are Actually Paying
Russian industrial electricity tariffs vary by region, contracted power level, voltage connection tier and time-of-use schedule. The figures below are indicative reference rates for 2025–2026 planning purposes and should be verified against your current electricity supply contract before use in financial modelling:
Small Industrial
6.5 – 8.5
RUB/kWh
Contracted power up to 150 kW. Typical for single ISBM line in a small factory.
Medium Industrial
5.5 – 7.5
RUB/kWh
150 – 670 kW. Multi-line facility. Use 7.0 RUB/kWh as planning midpoint.
Large Industrial
4.0 – 6.0
RUB/kWh
Above 670 kW. Large packaging plant with own substation. Lowest tariff tier.
Many Russian industrial facilities are on a two-zone tariff: a higher daytime rate (typically 1.2 to 1.5x the base rate) and a lower night rate (typically 0.7 to 0.9x base). If your ISBM line operates 24 hours, use a weighted average. If you have scheduling flexibility, operating the machine during off-peak hours — particularly the compressor, which can be sized with a larger receiver to shift some demand to night operation — can reduce effective electricity cost by 8 to 15%.
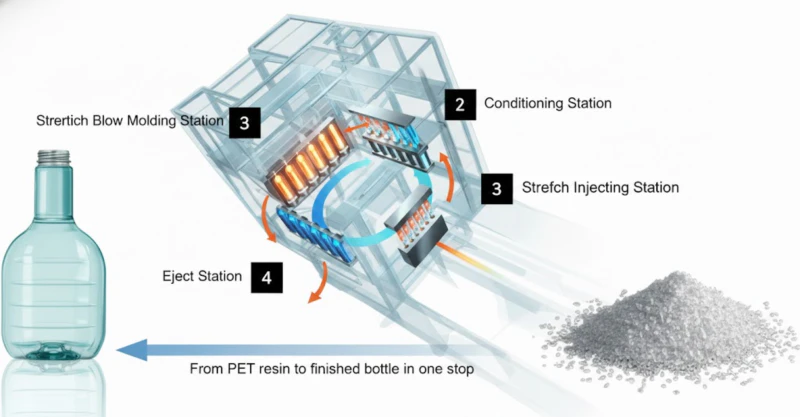
Fig. 2 — The 4-station ISBM cycle: injection (Station 1), conditioning (Station 2), blow (Station 3), ejection (Station 4). Each phase draws different power levels. The “running power” figure used in cost calculations is the time-average over the complete cycle — not the peak power during injection or the near-zero draw during cooling. Using peak power for cost calculations overestimates electricity cost by 60 to 120%.
6. The Annual Power Cost Formula
Two formulas cover the calculation from machine power data to annual electricity cost. Use the first when you know running power; use the second when you know only cycle time and bottle output rate:
Formula A — From Running Power
Costₐ = P𝒓𝒕𝒘 × H × R
P𝒓𝒕𝒘 = average line running power (kW) — machine + compressor + chiller + MTC
H = annual production hours
R = electricity rate (RUB/kWh)
Formula B — From Per-Bottle Energy
Costₐ = (E₁₀₀₀ × Bₐ ÷ 1,000) × R
E₁₀₀₀ = total line kWh per 1,000 bottles
Bₐ = annual bottles produced
R = electricity rate (RUB/kWh)
To convert from Formula A to Formula B, use the relationship:
7. Auxiliary Equipment: Compressor, Chiller and MTC Power
The machine panel power does not include auxiliary equipment on separate electrical feeds. For a complete line power cost, add the following auxiliary loads to the machine running power:
| Auxiliary Equipment | Typical Power | Primary Variable | Annual Cost (7 RUB/kWh, 6,000 h) |
|---|---|---|---|
| Oil-free air compressor (40-bar, 22 kW) | 14 – 18 kW running | Blow pressure demand and cavity count | 588,000 – 756,000 RUB |
| Industrial water chiller (8 – 15 kW) | 5 – 10 kW running | Coolant setpoint and ambient temperature | 210,000 – 420,000 RUB |
| Mold temperature controller | 1.5 – 3 kW running | Temperature differential and mold mass | 63,000 – 126,000 RUB |
| Conveyor, lighting and ancillaries | 0.5 – 1.5 kW | Constant | 21,000 – 63,000 RUB |
Air compressor sizing and power cost: The compressor is often the second-largest energy cost on an ISBM line, accounting for 25 to 35% of total line electricity consumption. An oversized compressor running at 40% load is significantly less efficient than a correctly sized unit at 75 to 85% load. A dedicated oil-free air compressor for ISBM matched to the machine model and cavity count runs at optimal efficiency, reducing compressor electricity cost by 15 to 25% compared to a shared factory compressor system that is rarely at its optimal operating point for ISBM air demand profiles.
8. Cost per Bottle: Translating kW into Ruble per Unit
The per-bottle electricity cost is the figure that connects machine power data to product pricing and margin analysis. It is calculated by dividing total line annual electricity cost by annual bottle production:
Electricity Cost per 1,000 Bottles
RUB₁₀₀₀ = E₁₀₀₀ × R
E₁₀₀₀ = total line kWh per 1,000 bottles | R = electricity rate (RUB/kWh)
Reference values for the HGY150-V4-EV at 7 RUB/kWh, 4-cavity PETG production at 3,600 BPH:
- ▶Machine only (32 kW running): E₁₀₀₀ = 32,000 ÷ 3,600 = 8.9 kWh/1,000. Cost = 8.9 × 7 = 62 RUB per 1,000 bottles
- ▶Full line (32 + 16 + 7 + 2 = 57 kW total): E₁₀₀₀ = 57,000 ÷ 3,600 = 15.8 kWh/1,000. Cost = 15.8 × 7 = 111 RUB per 1,000 bottles (0.11 RUB per bottle)
- ▶Equivalent hydraulic line (46 + 18 + 9 + 2 = 75 kW total): E₁₀₀₀ = 75,000 ÷ 3,600 = 20.8 kWh/1,000. Cost = 20.8 × 7 = 146 RUB per 1,000 bottles (0.146 RUB per bottle)
The 0.035 RUB per-bottle electricity cost difference between full-servo and hydraulic platforms appears small at the individual bottle level. At 12 million bottles per year, it accumulates to 420,000 RUB annually — the calculation that defines the payback period on the servo premium.
9. Five Measures That Reduce Power Cost Without Replacing Equipment
For operators running existing ISBM lines, the following measures reduce electricity cost without capital equipment replacement:
-
1Implement standby mode during planned stopsProgram the PLC to reduce barrel temperature to standby level after 8 to 10 minutes of non-production, and to unload the compressor after 5 minutes. This eliminates idle energy consumption during breaks and shift changeovers. Savings: 15 to 25% of total annual electricity cost with zero capital investment — often 200,000 to 400,000 RUB per year on a typical 2-shift operation.
-
2Increase cavity count on the existing machineA machine running at 2 cavities draws approximately the same power as the same machine at 4 cavities but produces half the output — doubling the kWh per bottle figure. If the machine has capacity for more cavities, the new mold investment produces one of the best energy efficiency returns available: the same running power spread across twice the bottles.
-
3Raise chiller setpoint to the minimum effective temperatureChiller power increases approximately 2 to 3% for each 1°C reduction in setpoint. Many ISBM lines run at 8°C when 14°C would achieve equal bottle quality (depending on wall thickness and resin). Raising from 8°C to 14°C reduces chiller power by 12 to 18% — typically 30,000 to 75,000 RUB per year at zero cost.
-
4Reduce blow pressure to the minimum effective levelBlow pressure is commonly set 15 to 25% above the minimum required for complete bottle formation — a conservative practice from initial setup that is rarely reviewed. Each 0.3 MPa reduction in blow pressure reduces compressor energy consumption by approximately 5 to 8%. Verify minimum effective pressure by progressive reduction with first-article dimensional checks.
-
5Insulate the barrel heating zonesAdding ceramic fibre insulation blankets around barrel heater zones reduces heat loss to ambient air and reduces heater duty cycle. At Russian factory ambient temperatures — which can be as low as 5°C in unheated buildings in winter — barrel insulation reduces heater energy consumption by 10 to 20%, typically saving 60,000 to 120,000 RUB per year on a single machine. Payback period: typically 4 to 8 months.
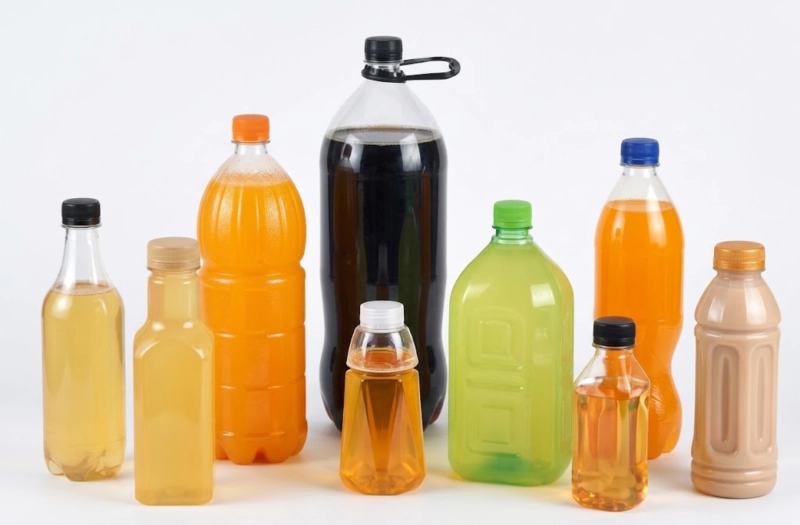
Fig. 3 — PETG cosmetic bottles at 0.111 RUB electricity cost per unit on a full-servo ISBM line at 7 RUB/kWh. On the equivalent hydraulic line, the same bottle carries 0.146 RUB electricity cost per unit. At a production volume of 12 million bottles per year, this 0.035 RUB per-bottle difference equals 420,000 RUB annually — a figure that appears in no product cost sheet but accumulates regardless.
10. Worked Examples: Three Machine Scenarios
The following examples apply the Formula A cost calculation to three typical production scenarios, including auxiliary equipment. Electricity rate: 7.2 RUB/kWh. Operating schedule: 20 hours production per day, 300 days per year (6,000 hours). Idle energy included at 4 hours per day at reduced load.
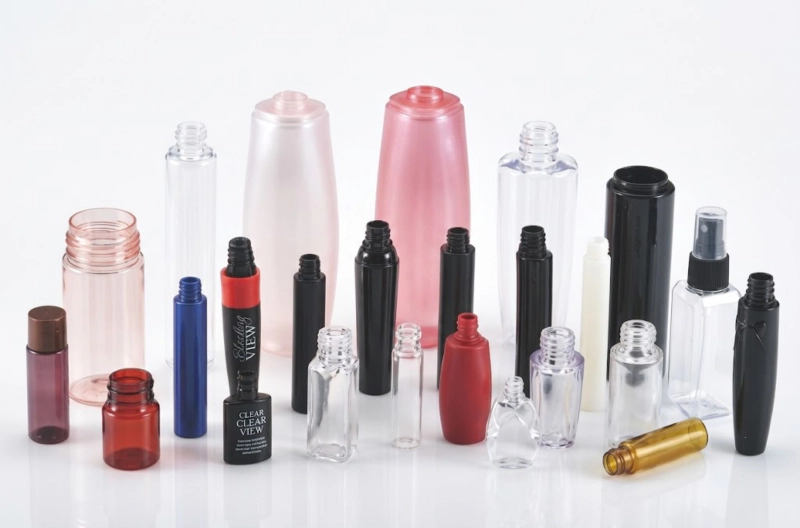
Fig. 4 — PETG cosmetic bottles from Scenario 2: 12.85 million units per year at 193.9 RUB electricity cost per 1,000 units. This figure — 0.194 RUB per bottle — is lower than most people estimate when they extrapolate from nameplate power. Using the actual 54.5 kW line running power rather than the 63.2 kW nameplate total (machine 53.2 + compressor 22 kW rated) produces a cost figure 14% lower and significantly more accurate for margin planning.
1. Never use nameplate power for cost budgeting. Full-servo machines run at 53 to 68% of rated power; hydraulic machines at 71 to 86%. Use the running power figures in this guide or measure your own with a calibrated power meter during steady-state production.
2. Include auxiliary equipment in total line cost. Compressor, chiller and MTC add 35 to 55% to the machine power cost. The machine nameplate alone understates total line electricity cost by this margin.
3. Idle energy is typically 15 to 25% of total cost. A machine running at full power 20 hours and idling 4 hours accumulates significant idle cost. Standby mode programming eliminates most of this at zero capital cost.
4. The servo premium pays back from electricity savings alone. The HGY150-V4-EV uses 10 kW less than the HGY150-V4 during production. At Russian industrial rates and typical operating schedules, this translates to 420,000 to 588,000 RUB per year in electricity savings — before any maintenance cost advantage is counted.
5. Per-bottle electricity cost is the decision metric. It connects machine power data to product pricing, margin and competitive position. For the HGY150-V4-EV in standard PETG cosmetic production, this figure is approximately 0.19 to 0.22 RUB per bottle at current Russian industrial electricity rates.
Want a Power Cost Calculation for Your Specific Production Scenario?
Send us your bottle specification, annual volume target, machine model interest, operating schedule and your electricity rate. Our engineers will produce a complete annual electricity cost calculation — machine, compressor, chiller and idle energy — for your specific scenario.