
The purchase price of an ISBM machine is the number that dominates procurement discussions, drives the budget approval process and appears prominently in every supplier quotation. It is also, over a ten-year operating life, typically the smallest of the major cost categories. Energy, tooling, maintenance, spare parts and operator labour collectively account for roughly two to three times the original machine investment — yet these costs are rarely modelled before the purchase decision is made. This guide builds a complete Total Cost of Ownership framework for ISBM machine investment, quantifies each cost category over a 10-year horizon, compares full-servo against hydraulic platforms and Chinese against Japanese machines using the same TCO model, and identifies the decisions that have the largest leverage on lifetime cost per bottle produced.
1. Why Purchase Price Alone Is a Misleading Metric
A packaging manufacturer evaluating two ISBM machines — one priced at USD 120,000 and one at USD 180,000 — typically frames the decision as a USD 60,000 choice. Over a ten-year production life, the cheaper machine may cost significantly more in total. Energy consumption differences alone between a hydraulic and a full-servo machine at the same production volume can amount to USD 80,000 to 120,000 over ten years at Russian industrial electricity rates. Add tooling, maintenance, spare parts, downtime and labour, and the machine that cost USD 60,000 less at purchase may cost USD 200,000 more over its operating life.
The reasons purchase price dominates procurement decisions despite this are structural:
- ▶Capital expenditure is approved through a different budget process than operating expenditure — the people making the purchase decision may not be accountable for the energy bill five years later.
- ▶Operating costs are uncertain at purchase time and are therefore not modelled — or are modelled optimistically with assumptions that do not survive contact with reality.
- ▶Suppliers have no incentive to present a TCO analysis that makes their machine look more expensive than a competitor’s — so buyers are rarely given the tools to make a properly informed comparison.
The TCO principle: A machine investment is not a capital expenditure — it is a commitment to a stream of future operating costs that will continue for 15 to 25 years. Evaluating machine options by purchase price alone is equivalent to choosing between cars based only on the sticker price without considering fuel consumption, insurance or service costs.
2. The TCO Framework: Seven Cost Categories
A complete ISBM TCO model covers seven categories. The typical proportions over a 10-year operating life at 6,000 production hours per year are:
Machine purchase price
~28%
The largest single-event cost but the smallest proportion of lifetime TCO. Its relative weight decreases as operating life extends beyond 10 years.
Energy cost
~24%
Electricity for machine drives, barrel heating, compressed air and chilled water. The cost category most sensitive to machine platform choice — full servo vs hydraulic creates a 25–40% energy cost difference.
Tooling (molds)
~20%
Preform mold, blow mold, neck ring sets and core rods — plus refurbishment and replacement cycles over 10 years. Often underestimated because initial tooling investment is visible but replacement cycles are not planned.
Operator labour
~14%
Machine operator allocation per shift, including quality inspection time. Full-servo machines with better process stability require fewer operator interventions per shift — reducing effective labour cost per bottle produced.
Spare parts and wear components
~8%
Seal kits, heater bands, sensor replacements, hydraulic fluid changes, servo drive modules, neck ring inserts and other consumables. Higher for hydraulic machines due to greater component count and fluid maintenance requirements.
Planned maintenance labour
~4%
Scheduled preventive maintenance tasks performed by in-house technicians or contracted service engineers. Includes lubrication, filter replacement, calibration checks and annual overhaul.
Unplanned downtime cost (lost production opportunity)
~2% direct — but multiplied effect on all other costs
Unplanned stoppages appear small in direct cost terms but carry a multiplied effect: every hour of unplanned downtime loses the contribution margin from all bottles that would have been produced. At 3,600 BPH on a 4-cavity PETG line with a margin of 8 RUB per bottle, one hour of unplanned downtime costs approximately 28,800 RUB in lost contribution — more than the cost of the spare part that caused the stoppage. This makes unplanned downtime the highest-leverage cost reduction target available without additional capital investment.
3. Category 1 — Energy Cost: The Largest Variable Expense
Energy is the largest ongoing operating cost on an ISBM line and the one with the greatest variance between machine platforms. A full-servo HGY150-V4-EV running at 31 kW total line draw versus a hydraulic HGY150-V4 running at 55 kW at the same output is not a marginal difference — it is a 43% energy cost advantage compounded over every production hour for the machine’s entire operating life.
| Cost Driver | HGY150-V4 (Hydraulic) | HGY150-V4-EV (Servo) | 10-Year Difference |
|---|---|---|---|
| Total line running power | 52 – 58 kW | 30 – 36 kW | ↓ ~22 kW |
| Annual energy (6,000 h production) | 324,000 kWh | 198,000 kWh | 126,000 kWh/yr |
| Annual energy cost (7 RUB/kWh) | 2,268,000 RUB | 1,386,000 RUB | 882,000 RUB/yr saved |
| 10-year energy cost | 22,680,000 RUB | 13,860,000 RUB | 8,820,000 RUB saved |
Assumptions: 6,000 production hours per year; 7 RUB/kWh industrial rate; idle energy not included. At 90 RUB/USD, 10-year energy saving = approximately USD 98,000.
4. Category 2 — Tooling: The Hidden Capital Commitment
Tooling cost is the most consistently underestimated element of ISBM investment. A buyer who compares two machines on purchase price alone is comparing only part of the upfront commitment — the molds required to produce the first product may cost 30 to 60 percent of the machine price, and over a ten-year operating life, tooling refurbishment and new product introductions will add further capital requirements.
| Tooling Component | Initial Investment (USD) | Typical Service Life | 10-Year Cost (USD) |
|---|---|---|---|
| Preform injection mold (4-cav) | 18,000 – 35,000 | 5 – 8 million shots | 36,000 – 70,000 |
| Blow mold set (4-cav) | 12,000 – 22,000 | 3 – 5 million cycles | 24,000 – 44,000 |
| Neck ring sets | 3,000 – 6,000 | 2 – 4 million cycles | 9,000 – 18,000 |
| Core rods (stretch rods) | 1,500 – 3,000 | 3 – 6 million cycles | 3,000 – 6,000 |
| New product tooling (2 new products over 10 years) | 35,000 – 65,000 each | — | 70,000 – 130,000 |
| Total tooling TCO (10 years) | — | — | USD 142,000 – 268,000 |
ASB mold compatibility and tooling TCO: A machine that is compatible with existing Nissei ASB molds eliminates the initial preform and blow mold investment for the first product — a saving of USD 30,000 to 57,000 at the start of the project. Over a 10-year TCO model, this single compatibility feature can represent a 8 to 12 percent reduction in total TCO, making ASB compatibility a significant financial consideration beyond its operational convenience.
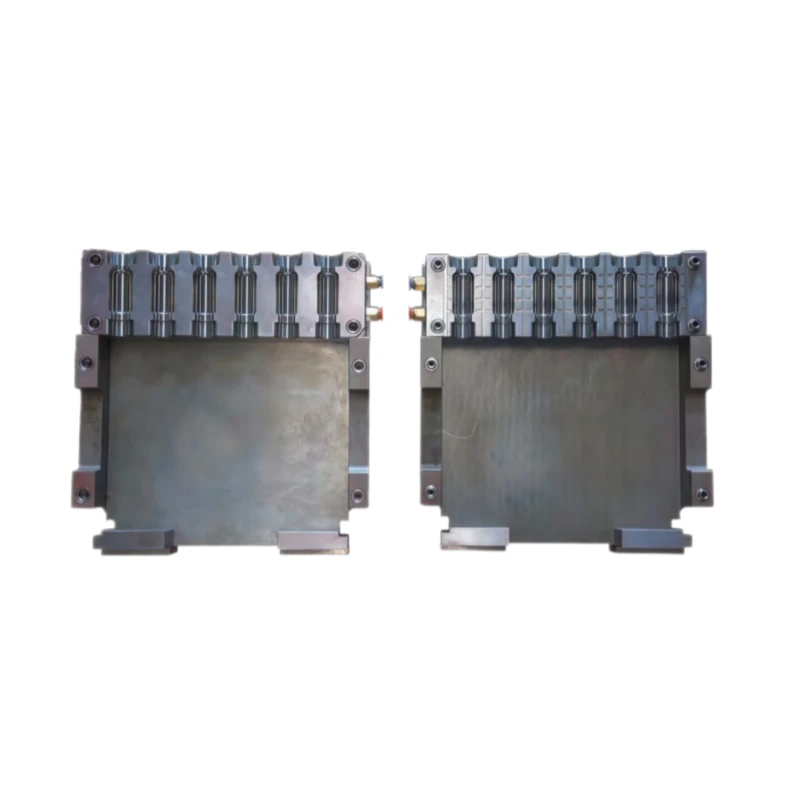
Fig. 1 — ISBM preform mold and blow mold sets. The combined tooling investment for a 4-cavity product launch — preform mold, blow mold and neck rings — typically runs USD 33,000 to 63,000 and is rarely included in initial machine investment comparisons. Over a 10-year operating life with two new product introductions, tooling may represent 20% of total TCO.
5. Category 3 — Maintenance and Spare Parts
Maintenance cost is significantly higher on hydraulic ISBM machines than on full-servo equivalents, for a structural reason: hydraulic systems have more wear points, require fluid management (sampling, changing and disposal), and consume pump seals and valve components at a rate that servo systems do not. A rough but reliable planning figure is annual maintenance cost of 2–4% of machine purchase price for hydraulic machines and 1–2% for full-servo machines.
| Cost Item | Hydraulic (Annual) | Full Servo (Annual) | 10-Year Difference |
|---|---|---|---|
| Seal kits and O-rings | USD 800 – 1,400 | USD 200 – 400 | USD 6,000 – 10,000 saved |
| Hydraulic fluid changes | USD 400 – 700 | None | USD 4,000 – 7,000 saved |
| Heater bands and thermocouples | USD 300 – 500 | USD 300 – 500 | Similar |
| Maintenance labour (in-house) | USD 1,200 – 2,000 | USD 600 – 1,000 | USD 6,000 – 10,000 saved |
| Annual total maintenance + spares | USD 2,700 – 4,600 | USD 1,100 – 1,900 | USD 16,000 – 27,000 / 10 yr |
6. Category 4 — Labour and Downtime Cost
Labour cost on an ISBM line comprises three elements: the production operator allocation per shift, the quality inspection time per shift, and the technician time for changeovers and unplanned fault response. Full-servo machines reduce the operator intervention frequency because servo-driven processes are more repeatable — parameter drift between cycles is lower, rejection rates are lower, and changeover is faster due to recipe recall from the PLC.
Downtime Cost Formula
Costₜ = BPH × CM × Hₜ
Costₜ = cost of one hour of unplanned downtime (RUB)
BPH = actual bottles per hour
CM = contribution margin per bottle (RUB)
Hₜ = hours of unplanned downtime
Example: A line running at 3,600 BPH with a contribution margin of 8 RUB per bottle loses 28,800 RUB per hour of unplanned downtime. At a typical ISBM unplanned downtime rate of 3–5% of planned production hours (180–300 hours per year on a 6,000-hour schedule), the annual downtime cost is 5.2 to 8.6 million RUB — often larger than the annual spare parts and maintenance budget combined.
A preventive maintenance programme that costs 200,000 RUB per year in materials and labour but reduces unplanned downtime from 4% to 2% of planned hours (saving 120 hours per year) delivers: 120 hours × 28,800 RUB/hour = 3,456,000 RUB saved per year — a 17x return on the maintenance investment. This calculation, applied to real line data, is typically the most powerful argument available for funding a preventive maintenance programme.
7. Full Servo vs Hydraulic: 10-Year TCO Comparison
Combining all cost categories into a single 10-year TCO model, the comparison between full-servo and hydraulic ISBM at the same production volume produces the following result:
| TCO Category | HGY150-V4 Hydraulic (USD) | HGY150-V4-EV Servo (USD) | Servo Saving |
|---|---|---|---|
| Machine purchase price | 110,000 | 145,000 | ↑ 35,000 more |
| Energy cost (10 years) | 252,000 | 154,000 | ↓ 98,000 |
| Tooling (10 years) | 200,000 | 200,000 | Equal |
| Maintenance and spares (10 years) | 36,500 | 15,000 | ↓ 21,500 |
| Operator labour (10 years) | 110,000 | 96,000 | ↓ 14,000 |
| Downtime cost (10 years, 4% vs 2.5%) | 96,000 | 60,000 | ↓ 36,000 |
| Total 10-Year TCO | USD 804,500 | USD 670,000 | ↓ USD 134,500 |
The payback calculation: The full-servo machine costs USD 35,000 more at purchase. The combined operating cost savings total USD 169,500 over 10 years. The payback period on the additional servo investment is approximately 35,000 ÷ (169,500 ÷ 10) = 2.1 years. For the remaining 7.9 years of the machine’s 10-year evaluation period, the full-servo machine returns USD 134,500 in net benefit — approximately equal to the original purchase price of the hydraulic machine.
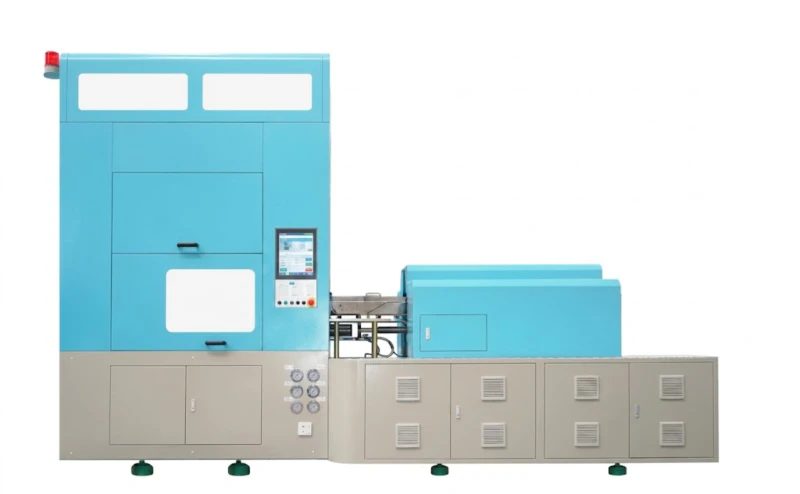
Fig. 2 — The HGY150-V4-EV full-servo ISBM machine. The USD 35,000 purchase price premium over the equivalent hydraulic model pays back in 2.1 years through energy savings alone. The combined 10-year operating cost advantage of USD 134,500 makes the full-servo machine the lower-TCO choice for any production schedule of 5,000 hours per year or more.
8. Chinese vs Japanese ISBM: Where the Real Cost Difference Lies
The purchase price gap between a Chinese ISBM machine and an equivalent Japanese machine (primarily Nissei ASB) is typically USD 60,000 to 150,000 in favour of the Chinese machine. TCO analysis reveals where this price gap narrows or widens over the operating life:
Where Chinese machines close the gap
- ✓Purchase price: USD 80,000 – 150,000 lower for comparable specification
- ✓Tooling: Chinese-built molds for Chinese machines are 40–60% lower cost than Japanese tooling
- ✓Spare parts: Priced significantly lower and available without Japanese import lead times
- ✓Energy consumption: Comparable on a full-servo vs full-servo basis
Where Japanese machines may have an advantage
- ▶Mechanical precision: Tighter machining tolerances may produce marginally lower scrap rates, reducing resin waste over high volumes
- ▶Service network: Global ASB service network vs Chinese supplier requiring remote support
- ▶Resale value: Japanese machinery holds residual value better in international secondary markets
- ▶Documentation quality: Japanese technical documentation is typically more comprehensive for in-house maintenance
The TCO conclusion for most Russian packaging manufacturers is that a well-selected Chinese ISBM machine from a genuine tier-one manufacturer will have a lower total 10-year cost than a Japanese equivalent, primarily because the purchase price and tooling savings outweigh the service network and documentation advantages. The critical qualifier is “well-selected” — the due diligence framework in the companion article on supplier evaluation is the prerequisite for this conclusion to hold.
9. The Ultimate Metric: TCO per 1,000 Bottles Produced
Once the 10-year TCO is established, dividing by the total bottles produced over the same period yields the TCO per 1,000 bottles — the metric that connects machine investment directly to product unit cost and competitive pricing capability.
TCO per 1,000 Bottles Formula
TCO₁₀₀₀ = Total 10-Year TCO ÷ (Annual Bottles × 10 ÷ 1,000)
Example: TCO USD 670,000 on 128 million bottles (10 yr) = USD 5.23 per 1,000 bottles
This figure can be directly compared between machine options. A machine that costs USD 1.50 more per 1,000 bottles over its operating life than a competitor — on a production volume of 128 million bottles — represents USD 192,000 in additional total cost. The TCO per 1,000 bottles metric makes abstract machine investment comparisons concrete and comparable.
10. Worked Example: 10-Year TCO for a 30ml PETG Cosmetic Line
A Russian cosmetics packaging manufacturer is evaluating the HGY150-V4-EV for a new 30ml PETG serum bottle. Machine price: USD 148,000. Operating schedule: 20 hours per day, 300 days per year (6,000 hours). 4-cavity mold. Production rate: 3,600 actual BPH (OEE 0.82). Contribution margin: 9 RUB per bottle. Electricity: 7.2 RUB/kWh. USD/RUB: 90.
-
1Machine purchase priceUSD 148,000 (one-time). Installation and commissioning: USD 8,000. Total initial capital: USD 156,000.
-
210-year energy costTotal line power 33 kW average. Annual energy: 33 × 6,000 = 198,000 kWh. Annual cost: 198,000 × 7.2 = 1,425,600 RUB = USD 15,840. 10-year total: USD 158,400.
-
310-year tooling costInitial 4-cavity set: USD 52,000. One refurbishment at year 5: USD 18,000. One new product tooling at year 4: USD 55,000. 10-year tooling total: USD 125,000.
-
410-year maintenance and sparesFull-servo maintenance budget: USD 1,500/year average. 10-year total: USD 15,000. Compressor and chiller spares: USD 8,000 over 10 years.
-
510-year operator labour and downtimeOperator cost allocation: 0.5 FTE per shift × 2 shifts × 12 RUB/minute × 6,000 hours = 8,640,000 RUB = USD 96,000. Downtime (2.5%): 150 hours/year × 3,600 BPH × 9 RUB = 4,860,000 RUB/year = USD 54,000/year. 10-year downtime: USD 540,000. Labour: USD 96,000.
-
6Total 10-year TCO156,000 + 158,400 + 125,000 + 23,000 + 96,000 + 540,000 = USD 1,098,400. Annual bottles: 3,600 × 6,000 × 0.82 = 17,712,000. 10-year total: 177,120,000. TCO per 1,000: 1,098,400 ÷ 177,120 = USD 6.20 per 1,000 bottles.
Downtime cost (USD 540,000) is by far the largest 10-year cost category — 49% of total TCO excluding the machine purchase price. It exceeds energy, tooling, maintenance and labour combined. The single highest-leverage TCO reduction available to this line is not a machine upgrade, not an energy efficiency programme, and not tooling rationalisation. It is a planned maintenance programme that reduces unplanned downtime from 2.5% to 1.5% — saving 60 hours per year, 600 hours over 10 years, worth USD 324,000 at 3,600 BPH and 9 RUB contribution margin.
TCO and auxiliary equipment: The air compressor and chiller are frequently omitted from ISBM TCO models because they are treated as utility infrastructure rather than line-specific investment. In practice, a dedicated oil-free air compressor for ISBM sized correctly for the line contributes to downtime reduction (by eliminating pressure-drop-induced short-blow defects), to energy efficiency (by running at 70–85% load rather than cycling between load and unload), and to product quality (by eliminating oil contamination in the blow air circuit). All three effects are quantifiable in TCO terms and should be included in the full investment model.
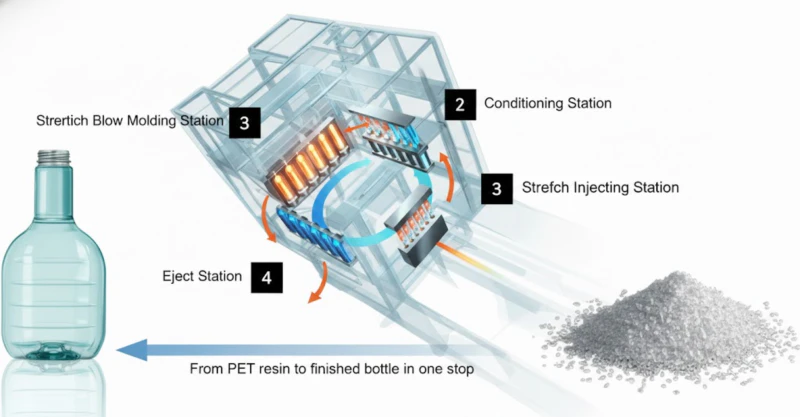
Fig. 3 — Every cycle of the 4-station ISBM process consumes energy, produces wear on tooling and mechanical components, requires operator attention, and generates either a good bottle or a reject. TCO analysis quantifies all these effects over the machine’s operating life — and identifies which of them has the greatest leverage on the cost per bottle produced.
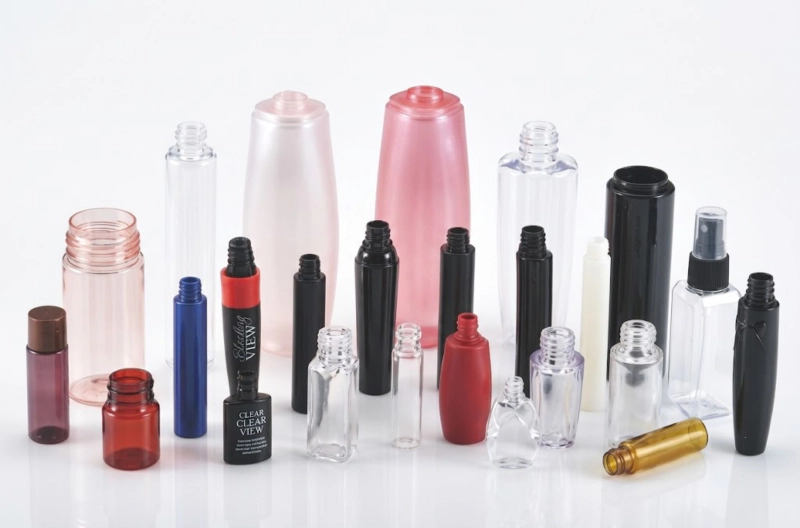
Fig. 4 — Premium PETG cosmetic bottles. At USD 6.20 per 1,000 bottles TCO, the machine investment, energy, tooling, maintenance, labour and downtime collectively contribute 0.62 US cents per bottle to the production cost. A 10% improvement in OEE — achievable through preventive maintenance and operator training — reduces this to 0.56 cents per bottle, a saving that compounds across every bottle produced for the remaining machine life.
1. Purchase price is the smallest major cost category. Over 10 years at 6,000 production hours per year, energy, tooling, labour and downtime collectively outweigh the machine purchase price by a factor of 2.5 to 4.
2. Full-servo machines have a 2-year energy payback period. The USD 35,000 purchase price premium on a full-servo HGY150-V4-EV returns USD 134,500 in operating cost savings over 10 years — a 3.8x return on the premium.
3. Tooling must be included in the investment model. The 10-year tooling commitment typically equals or exceeds the machine purchase price. ASB mold compatibility reduces the initial tooling investment by USD 30,000 to 57,000.
4. Unplanned downtime is the largest controllable cost driver. In the worked example, downtime cost exceeded all other operating costs combined. A preventive maintenance investment with a 17x annual return is the highest-ROI project available to most ISBM operators.
5. TCO per 1,000 bottles is the decision metric. It translates abstract machine investment comparisons into a per-unit cost figure that connects directly to pricing, margin and competitive position.
Want a Custom TCO Model for Your Production Volume?
Send us your bottle specification, annual volume target, operating schedule, electricity rate and operator cost. Our engineers will build a full 10-year TCO comparison for the machine platforms you are evaluating — giving you the numbers to make a properly informed investment decision.