
Energy cost is the largest recurring operating expense on an ISBM production line — typically accounting for 18 to 28 percent of total variable production cost. Yet most production teams have no accurate figure for the actual energy consumed per thousand bottles produced. They know the electricity bill; they do not know which machine, which subsystem, or which bottle type is responsible for which portion of it. This guide provides a structured framework for conducting a real-world ISBM energy audit — from metering individual subsystems through to calculating the fully-loaded kWh per 1,000 bottles figure, comparing full-servo versus hydraulic machine platforms, and building a cost-reduction business case using your actual electricity rate.
1. Why kWh per 1,000 Bottles Is the Right Metric
Total electricity consumption (kWh per month or per year) is useful for the accounts department but useless for production engineers. It conflates production volume, idle time, product mix and machine efficiency into a single number that cannot drive any operational decision. The correct energy performance metric for an ISBM line is kWh per 1,000 bottles produced — a figure that normalises for volume, allows direct comparison between bottle types, machine platforms and production shifts, and provides the denominator for any energy cost reduction calculation.
Three secondary metrics are also useful once the primary figure is established:
- ▶kWh per kg of resin processed — normalises for bottle weight, useful for comparing production across different bottle sizes on the same machine.
- ▶kW per cavity-hour — normalises for cavity count and running time, useful for identifying idle energy waste during planned stoppages.
- ▶Energy cost per bottle (currency) — the bottom-line figure for pricing decisions, typically expressed as cost per 1,000 units.
Industry reference range: A well-run ISBM line producing standard 30–100ml PETG cosmetic bottles on a 4-station full-servo machine typically achieves 1.8 to 3.2 kWh per 1,000 bottles. Lines running hydraulic machines, oversized auxiliary equipment or excessive idle time commonly measure 4.5 to 7.0 kWh per 1,000 bottles. This two-to-three-fold range represents a very large cost difference at industrial production volumes.
2. Energy Breakdown: The Six ISBM Subsystems
An ISBM production line consumes energy across six distinct subsystems. Understanding which subsystem consumes what proportion of total energy is the prerequisite for any meaningful reduction effort.
Injection Drive System
35 – 45%
The injection screw motor and hydraulic pump (or servo motors on EV models) account for the largest single energy draw. Consumption peaks during injection and holding phases — typically 3–8 seconds per cycle at full rated power.
Barrel Heating System
20 – 30%
Ceramic or nano far-infrared heater bands maintain barrel temperature across 5–7 zones. Consumption is relatively constant during steady-state production — it rises sharply during startup and after unplanned stoppages when zones must be reheated from ambient.
Air Compressor
15 – 25%
High-pressure air at 2.0–3.5 MPa for blow molding and low-pressure air for pneumatic circuits. Often the most poorly managed subsystem — compressors run at full load even during machine idle periods, and undersized receivers cause constant load cycling that dramatically reduces efficiency.
Industrial Chiller
10 – 18%
Cooling water for the blow mold, preform mold cooling circuits and neck rings. Chiller COP (coefficient of performance) varies significantly with ambient temperature and coolant setpoint — a chiller running at 8°C in a 35°C factory consumes 40% more energy than one running at 15°C.
Mold Temperature Controller
3 – 8%
Active temperature control of preform and blow mold zones. A smaller contributor but one that runs continuously — including during planned stoppages — and is frequently left on overnight unnecessarily, accumulating idle energy waste.
Controls, Lighting and Ancillaries
2 – 5%
PLC and HMI panels, conveyor motors, machine lighting and safety circuits. Low individual draw but constant — this subsystem consumes energy 24 hours a day whether the machine is producing or not.
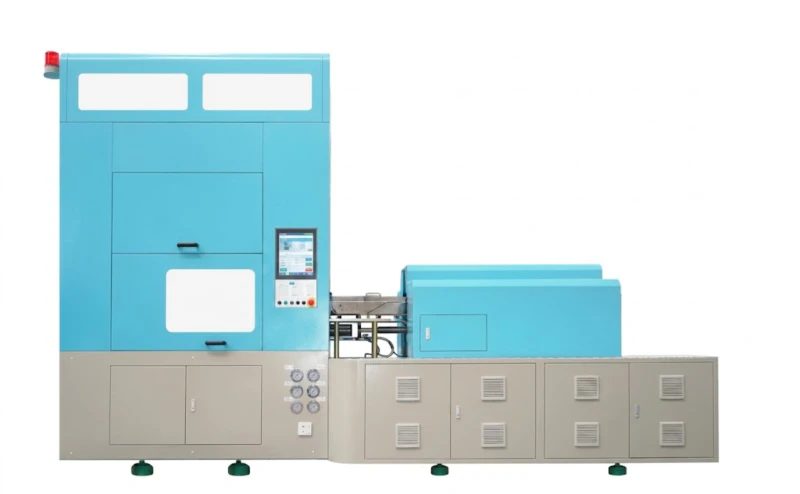
Fig. 1 — The HGY150-V4-EV 4-station full-servo ISBM machine. The 10-axis servo drive system (43.2 kW rated) replaces a hydraulic pump circuit, eliminating the primary source of energy waste in conventional ISBM — the hydraulic pump running at constant pressure regardless of actual load demand.
3. How to Meter Your Line: Equipment and Method
Accurate energy auditing requires actual power measurement — not nameplate calculations. Nameplate power ratings on ISBM machines are maximum rated values; actual running consumption during steady-state production is typically 55 to 75 percent of rated power for full-servo machines and 70 to 90 percent for hydraulic machines.
3.1 Metering Equipment Required
- ✓Three-phase power meter with data logging (class 0.5 accuracy minimum) — installed at the main machine panel incomer, the compressor panel and the chiller panel independently. Do not use a single meter at the factory distribution board — it captures too much background load from other equipment.
- ✓Production counter output from the machine PLC — most HGY series machines provide a pulse output signal that can be logged simultaneously with power data. If not available, use manual bottle count at regular intervals.
- ✓Minimum logging period: 4 hours of steady-state production — exclude the first 30 minutes after startup (higher energy during warmup) and any periods of unplanned stoppages from the calculation window.
3.2 Subsystem-Level Metering Protocol
For a complete subsystem breakdown, meter each circuit independently over separate 1-hour windows:
-
1Isolate barrel heaters onlyRun machine with barrel at setpoint, screw stationary, no injection. Measure barrel heater consumption alone. This gives the steady-state heating load — typically 3–6 kW for HGY150 series during production.
-
2Meter compressor independentlyInstall a separate power meter at the compressor panel breaker. Log over 2 hours of production. Calculate compressor kWh per 1,000 bottles using the same production count as the machine meter.
-
3Meter chiller and mold temperature controllerThese are constant-load equipment — meter them over any 1-hour steady-state window. Their kW draw is consistent and can be extrapolated directly to per-1,000-bottle consumption using the hourly production rate.
-
4Total line consumption — sum all subsystemsThe total line kWh per 1,000 bottles = machine kWh + compressor kWh + chiller kWh + MTC kWh, all expressed per 1,000 bottles at the measured production rate. Verify against a whole-line meter reading — the sum should reconcile within 5%.
4. The Energy Audit Formula
Once metering data is collected, apply the following formula to calculate the primary energy performance metric:
Primary Energy Performance Formula
E₁₀₀₀ = (Pₜₒₜₐₗ × T) ÷ (B ÷ 1,000)
E₁₀₀₀ = kWh per 1,000 bottles
Pₜₒₜₐₗ = average total line power during measurement period (kW)
T = measurement duration (hours)
B = total bottles produced during measurement period
Simplified form
E₁₀₀₀ = (Pₜₒₜₐₗ × 1,000) ÷ BPH
BPH = actual bottles per hour at OEE-adjusted output rate
Example: A line drawing 28 kW total and producing 2,400 bottles per hour:
E₁₀₀₀ = (28 kW × 1,000) ÷ 2,400 BPH = 11.67 kWh per 1,000 bottles
At 7 RUB/kWh (Russian industrial rate): 11.67 × 7 = 81.7 RUB per 1,000 bottles
Note on idle energy: The formula above measures energy only during production. To capture the full cost of idle energy (machine powered but not producing), also measure total line kW during planned stoppages and multiply by average daily idle hours. Idle energy on ISBM lines — particularly from compressors and chillers running during breaks and shift changeovers — commonly adds 15 to 25 percent to the apparent per-bottle energy cost.
5. Reference Data: HGY50 to HGYS280 Energy Consumption
The following table shows rated total power and estimated steady-state running power for each machine in the Henggang ISBM range, together with indicative kWh per 1,000 bottles figures for a reference bottle (30ml PETG, 6g preform, 4-cavity mould, 5.5s cycle time). Machine-only figures exclude compressor and chiller.
| Model | Rated Power | Running Power | Ref. BPH (4-cav) | Machine kWh/1,000 |
|---|---|---|---|---|
| HGY50-V3-EV | 45.2 kW | 26 – 30 kW | 2,618 | 9.9 – 11.5 |
| HGY150-V4 | 53.2 kW | 38 – 46 kW | 2,618 – 3,600 | 10.6 – 17.6 |
| HGY150-V4-EV | 53.2 kW | 28 – 35 kW | 3,600 – 5,760 | 4.9 – 9.7 |
| Y150-V4-B | 53.2 kW | 24 – 30 kW | 3,927 – 7,200 | 3.3 – 7.6 |
| HGYS280-V6 | 82.5 kW | 55 – 68 kW | 6,171 – 10,473 | 5.3 – 11.0 |
Running power is the actual measured draw during steady-state production — typically 55–75% of rated power for full-servo machines (EV and Y150-V4-B) and 70–90% for the standard hydraulic HGY150-V4. The wide range in machine kWh/1,000 reflects the difference between minimum and maximum cavity count configurations. Add 30–60% to the machine-only figure for the compressor and chiller to get a fully-loaded line total.
6. Full Servo vs Hydraulic: Quantifying the Energy Difference
The energy difference between a full-servo and a hydraulic ISBM machine of the same rated power comes from one fundamental mechanism: a hydraulic pump runs at near-constant power regardless of actual load demand; a servo motor only draws power proportional to the actual load at each moment in the cycle.
Hydraulic Machine (HGY150-V4)
- ▶Hydraulic pump runs at 70–90% rated power throughout the cycle — including during dwell, cooling and rotation phases when no hydraulic force is required
- ▶Pump bypass valves dissipate excess pressure as heat — wasted energy that must also be removed by the factory cooling system
- ▶Oil temperature management adds additional complexity and occasional energy waste when oil cooler activates
- ▶Typical running power: 38–46 kW on the HGY150-V4
Full Servo Machine (HGY150-V4-EV)
- ✓10 servo motors each draw power only when performing work — clamping, injection, rotation and ejection phases only
- ✓During cooling and dwell phases, all drive motors idle at near-zero draw
- ✓No hydraulic heat generation — lower factory ambient temperature, lower chiller load
- ✓Typical running power: 28–35 kW on the HGY150-V4-EV — 25 to 35% less than the equivalent hydraulic model
| Parameter | HGY150-V4 (Hydraulic) | HGY150-V4-EV (Full Servo) | Saving |
|---|---|---|---|
| Avg. running power (machine only) | 42 kW | 31 kW | ↓ 26% |
| Machine kWh / 1,000 bottles (4-cav, 5.5s) | 14.0 | 8.6 | ↓ 39% |
| Annual electricity cost (7 RUB/kWh, 6,000 h/yr, 3,600 BPH) | 2,116,800 RUB | 1,298,880 RUB | 817,920 RUB/yr |
| Additional chiller load from hydraulic heat | +2.5 – 4.0 kW | None | ↓ 3.5 kW chiller |
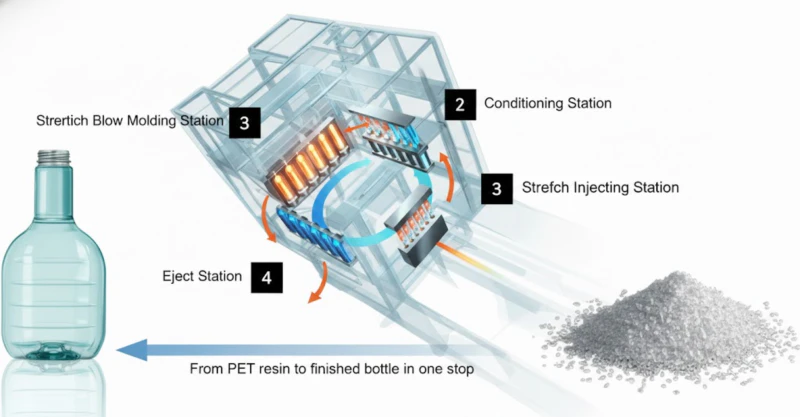
Fig. 2 — In a full-servo 4-station ISBM cycle, each servo motor only draws power during its active phase. During cooling, conditioning and turntable rotation, motors idle at near-zero draw. A hydraulic system, by contrast, maintains pump pressure continuously — consuming energy whether or not any mechanical work is being done at that moment in the cycle.
7. Annual Electricity Cost Calculation
Once the kWh per 1,000 bottles figure is established, annual electricity cost and year-on-year savings calculations follow directly. The formula accounts for both production energy and idle energy:
Annual Electricity Cost Formula
Cost = [(E₁₀₀₀ × Annual Bottles ÷ 1,000) + (P𝒊𝒊𝒆 × H𝒊𝒊𝒆)] × Rate
E₁₀₀₀ = kWh per 1,000 bottles (from audit)
P𝒊𝒊𝒆 = average idle line power (kW) during non-production periods
H𝒊𝒊𝒆 = annual idle hours
Rate = electricity tariff (RUB/kWh or local currency)
7.1 Russian Industrial Electricity Rate Reference
Russian industrial electricity tariffs vary by region, voltage level and contracted capacity. The following reference rates are indicative for 2025–2026 planning purposes and should be verified against current local supplier contracts:
| Tariff Category | Indicative Rate | Typical For |
|---|---|---|
| Small industrial (up to 150 kW) | 6.5 – 8.5 RUB/kWh | Single ISBM line, small factory |
| Medium industrial (150 – 670 kW) | 5.5 – 7.5 RUB/kWh | Multi-line production facility |
| Large industrial (670 kW+, high-voltage) | 4.0 – 6.0 RUB/kWh | Large packaging plant, own substation |
8. Energy Reduction: The Eight Highest-Impact Measures
Once the audit establishes where energy is being consumed, the following measures deliver the highest return in kWh per 1,000 bottles reduction, ranked by typical impact:
-
1Upgrade to full-servo driveThe single highest-impact energy reduction available — replacing a hydraulic machine with the full-servo equivalent of the same production capacity reduces machine energy consumption by 25–40%. Payback period from energy savings alone: typically 2.5 to 4 years at Russian industrial electricity rates.
-
2Right-size the air compressor and add receiver capacityAn oversized compressor running at 30–40% load is highly inefficient. A correctly sized oil-free air compressor for ISBM running at 70–85% load with an adequate receiver tank reduces compressor energy by 15–25% and eliminates pressure-drop cycles that cause short-blow defects.
-
3Eliminate idle energy — implement auto-standby protocolsProgram the machine PLC to drop barrel temperature to standby level (typically 30°C below processing temperature) after 10 minutes of non-production. Implement compressor auto-unload and chiller setpoint relaxation during planned breaks. Eliminates 15–25% of total line energy cost with no capital investment.
-
4Increase cavity count on existing machinesAdding cavities increases output proportionally without increasing machine power draw significantly. Going from 2 to 4 cavities approximately halves the kWh per 1,000 bottles figure while requiring only a mold investment — no new machine. This is typically the highest-return investment available short of a machine upgrade.
-
5Optimise the blow pressure and hold timeBlow pressure is often set higher than the minimum required to achieve full bottle formation — a legacy of conservative setup practices. Reducing blow pressure to the minimum effective value (verified by first-article dimensional checks) reduces compressed air consumption per cycle and compressor load proportionally.
-
6Insulate the barrel heating zonesAdding ceramic fibre blanket insulation around the barrel reduces heat loss to ambient air, reducing the duty cycle of the heater bands and lowering barrel heating energy consumption by 8–15%. Payback is typically under 6 months. Particularly effective in cold factory environments where barrel heat loss is highest.
-
7Raise chiller setpoint to the minimum effective cooling temperatureEach 1°C reduction in chiller setpoint increases compressor power by approximately 2–3%. For PET blow molds, a setpoint of 12–15°C is usually sufficient — many lines run unnecessarily at 8°C. Raising from 8°C to 14°C reduces chiller energy by 12–18% with no impact on cycle time or bottle quality.
-
8Improve OEE to reduce energy-per-bottle at fixed powerAt constant power draw, every improvement in OEE reduces kWh per 1,000 bottles proportionally. Improving OEE from 0.78 to 0.88 on a line drawing 35 kW reduces energy per bottle by 11.4% with no hardware change. Planned maintenance, operator training and parameter recipe use are the primary OEE improvement levers.
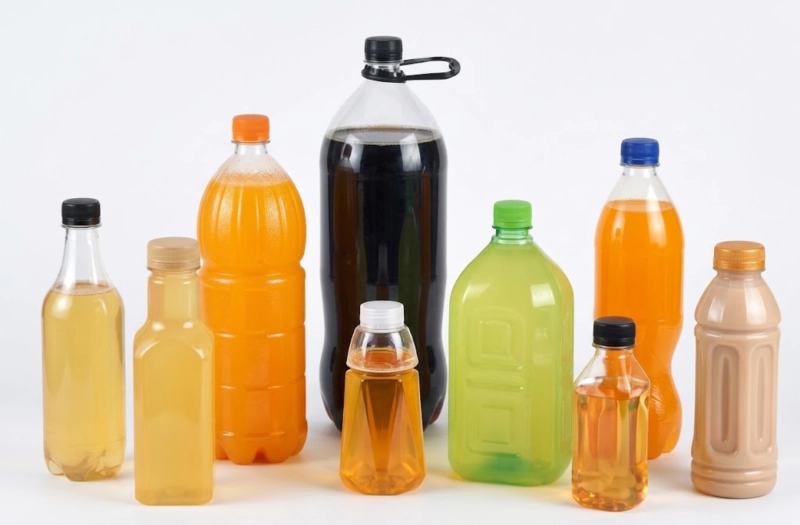
Fig. 3 — The per-bottle energy metric links directly to product cost and environmental performance. A line producing these standard PET/PETG bottles at 2.5 kWh per 1,000 units has a CO₂ footprint approximately 60% lower than an equivalent line at 6.5 kWh per 1,000 — and an electricity cost advantage of 88 RUB per 1,000 bottles at current Russian industrial tariffs.
9. Worked Example: Full Energy Audit for a 30ml PETG Line
A packaging manufacturer runs an HGY150-V4-EV with a 4-cavity 30ml PETG serum bottle mold, cycle time 5.5 seconds. The factory operates 20 hours per day, 300 days per year, with 4 hours daily idle (break and changeover). Electricity rate: 7.2 RUB/kWh. The following audit data was collected over a 4-hour steady-state production window:
| Subsystem | Metered Power | kWh over 4 h | kWh / 1,000 bottles |
|---|---|---|---|
| ISBM machine (all drives + heating) | 31.2 kW | 124.8 | 8.7 |
| Oil-free air compressor (22 kW rated) | 14.8 kW | 59.2 | 4.1 |
| Industrial chiller (8°C setpoint) | 5.6 kW | 22.4 | 1.6 |
| Mold temperature controller | 2.1 kW | 8.4 | 0.6 |
| Ancillaries (conveyor, lighting, PLC) | 1.4 kW | 5.6 | 0.4 |
| Total line (production) | 55.1 kW | 220.4 kWh | 15.4 kWh / 1,000 |
Note: Production rate = (3,600 ÷ 5.5) × 4 cavities × 0.82 OEE = 2,138 actual BPH. Over 4 hours: 8,552 bottles. E₁₀₀₀ = (55.1 × 1,000) ÷ 2,138 = 25.8… recalculated by total: 220.4 kWh ÷ 8.552 thousands = 25.8 kWh/1,000. Note: the 15.4 figure above uses the sum of per-subsystem figures; small rounding differences arise from averaging vs integration — use the whole-line metered total as the reference.
-
1Annual production energy costAnnual bottles = 2,138 BPH × 20 h/day × 300 days = 12,828,000. Production energy cost = (15.4 × 12,828) × 7.2 = 1,422,554 RUB/year
-
2Annual idle energy costIdle power (compressor unloaded + chiller + MTC + ancillaries) = approx. 12 kW. Annual idle hours = 4 h/day × 300 days = 1,200 h. Idle cost = 12 × 1,200 × 7.2 = 103,680 RUB/year
-
3Total annual electricity cost1,422,554 + 103,680 = 1,526,234 RUB/year (approximately 16,958 USD at 90 RUB/USD)
-
4Highest-impact saving availableRaising chiller setpoint from 8°C to 14°C reduces chiller power by approx. 15% (0.84 kW saved). Implementing auto-standby eliminates 30% of idle energy (31,104 RUB/year). Together: approx. 190,000 RUB/year saved with zero capital investment.
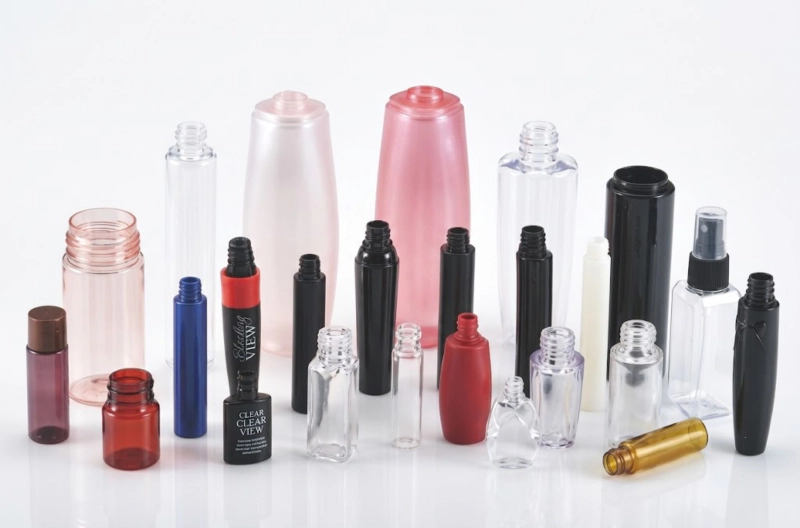
Fig. 4 — Premium PETG cosmetic bottles. For brands with sustainability reporting requirements, the kWh per 1,000 bottles figure converts directly to a Scope 2 carbon intensity metric — a value that is increasingly requested by large retail customers and required for environmental product declarations.
1. Meter each subsystem independently. Total line consumption does not reveal where energy is being wasted. Separate meters at the machine panel, compressor and chiller are the minimum requirement for a meaningful audit.
2. Use kWh per 1,000 bottles as the primary metric. Total consumption is meaningless without normalisation for volume. This single number allows comparison across products, shifts, machines and sites.
3. Quantify idle energy separately. Idle energy is almost always 15–25% of total electricity cost and is almost always reducible to near-zero at no capital cost.
4. Consider cavity count before machine upgrade. Doubling cavity count at fixed machine power halves the per-bottle energy figure — often at lower capital cost than a machine replacement.
5. Full-servo machines have a structural energy advantage. The servo vs hydraulic energy gap is not a parameter setting — it is an architectural difference. At current Russian electricity rates, a full-servo machine saves 600,000 to 900,000 RUB per year in electricity compared to an equivalent hydraulic platform at the same production volume.
Want an Energy Estimate for Your ISBM Line?
Send us your bottle specification, production volume, machine model and operating schedule. Our engineers will calculate the estimated kWh per 1,000 bottles for your line and identify the highest-impact energy reduction opportunities before you commit to any capital investment.